Geography with japandata
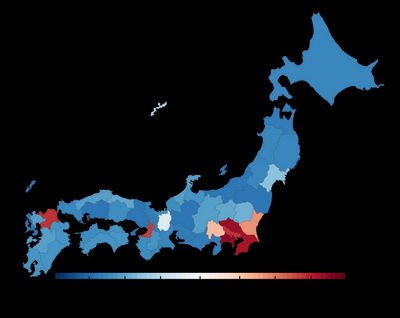
projects japan geospatialI often want to visualize some geographic or demographic data about Japan. For example, here is a map I made showing how people migrated between prefectures in 2021.
Sometimes I want to do this kind of mapmaking at the municipal level, keeping in mind that the municipal map changes over time as cities merge and reorganize. Here for example is another map I made, this time of migration out of coastal cities in Iwate Prefecture in 2011, the year it was struck by the 2011 Tōhoku earthquake and tsunami.
2011 Exodus From Iwate Coast
It takes a fair amount of data wrangling to organize this geographic and demographic data, but once it’s in hand it can be used as a foundation for many different analyses. That’s why I made japandata, a Python package that provides easy access to this basic data about Japan.
For now japandata has four modules, giving access to four underlying datasets.
japandata.maps, which provides present and historical maps of Japan, its prefectures, and municipalities, compiled by Asanobu Kitamoto of the ROIS-DS Center for Open Data in the Humanities.japandata.population: Prefectural and municipal demographic data about gender and age distributions, birth rates, migrations, and non-Japanese residents, annually since 1967 from the Basic Register of Residents.japandata.indices: Annual indicators about the fiscal health of municipal and prefectural governments, compiled by the Ministry of Internal Affairs.japandata.readings: Kana and romaji readings of place names, which in other datasets are provided only in Kanji.
These datasets have been processed to make them easy to use and easy to combine, and every step of the processing is visible in the source code. Along with the library I also provide example code to make maps like the ones in this post.
So head on over to the GitHub repository and get started with japandata today!